Research Interests
Line-intensity mapping ([CII], CO, 21-cm); cosmic large-scale structure; Epoch of Reionization; data reduction and analysis, map-making, systematics (atmosphere, scanning, noise, RFI) modeling; Cosmic Microwave Background (CMB) observables; Sunyaev–Zel’dovich (SZ) effect.
Current Projects
End-to-end Epoch of Reionization Spectrometer (EoR-Spec) simulations
EoR-Spec instrument is a spectrometer to be deployed on the Fred Young Submillimeter Telescope (FYST) designed to measure the redshifted 158 μm ionized-Carbon line using the Line-Intensity Mapping (LIM) technique. I developed highly realistic end-to-end simulations including atmospheric noise and telescope motion for this spectrometer and generated a mock observation dataset. Thereafter, I studied the effect of a filter-and-bin map-making pipeline on the LIM power spectrum and demonstrated that the pipeline can successfully filter out systematics from atmospheric noise and telescope motion/ turn-arounds. These simulations and data-reduction analysis will be critical to achieve science results and LIM signal detection with FYST.
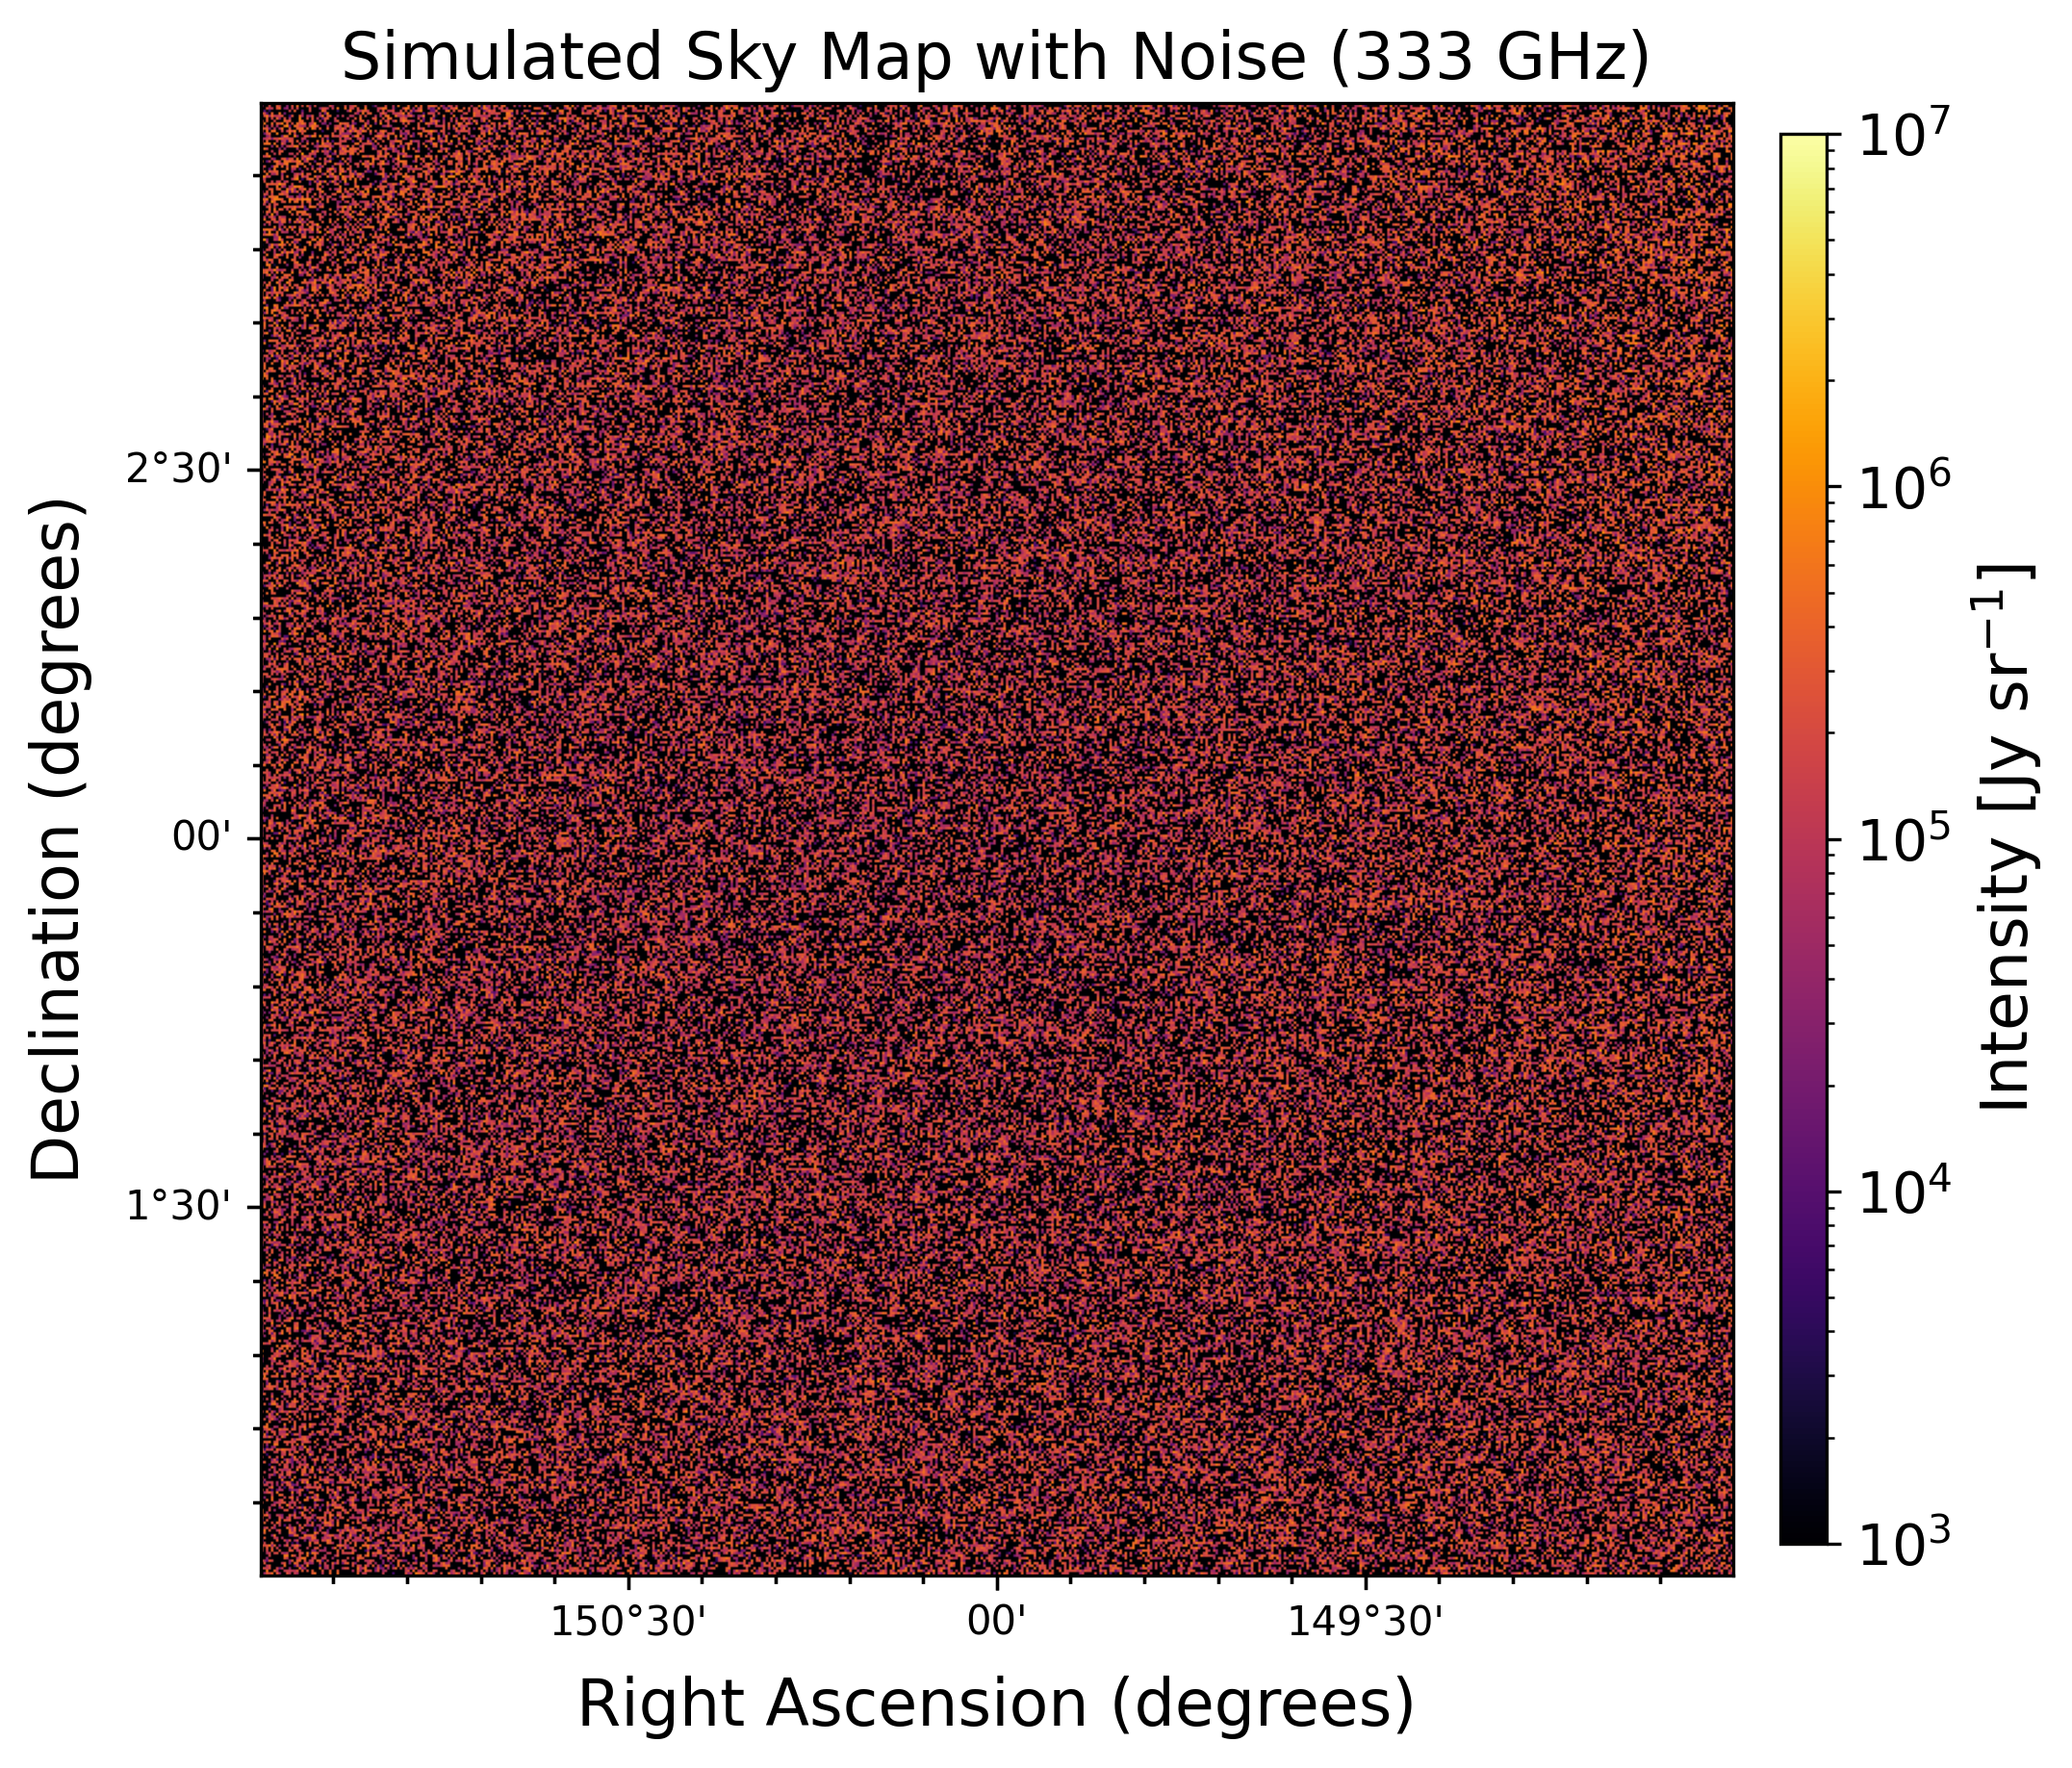
Figure: (Left) Simulation of the EoR-Spec instrument at various spectral setting scanning through the 210 GHz to 420 GHz frequency range. (Right) An example map produced by the end-to-end simulations at 333 GHz after observing for about 25% of the total planned survey. The pipeline was able to remove all atmospheric and telescope motion systematics and the map is at the white noise level.
CCAT/FYST continuum camera data-reduction and map-making pipeline
Prime-Cam is one of the two primary intruments on-board FYST, that will be eventually populated with 5 continuum cameras and 2 spectrometers. The first-light is fast approaching and in 2026 the telescope is expected to deploy the first 2 of continuum cameras observing at 280 GHz and 350 GHz. Close to 10,000 Kinetic Inductance detectors (KIDs) will populate the focal-planes of the 280 GHz and 350 GHz bands, producing tens of terabytes (TB) of data per year. A major challenge is to analyse and reduce the large data-sets efficiently and produce science ready sky images (called maps).
I am currently leading the effort for developing the data-reduction pipeline for these instruments. Working closely with the CCAT Data-center and Cornell University Center for Advanced Computing (CAC), I am testing a Maximum-Likelihood map-making method using the sotodlib reduction pakage on simulated datasets and estimating the computing power required to do data reduction. We are performing a number of weak and strong scaling tests on the RAMSES HPC Cluster installed at University of Cologne to optimise our MPI performance, and to identify computing bottlenecks.
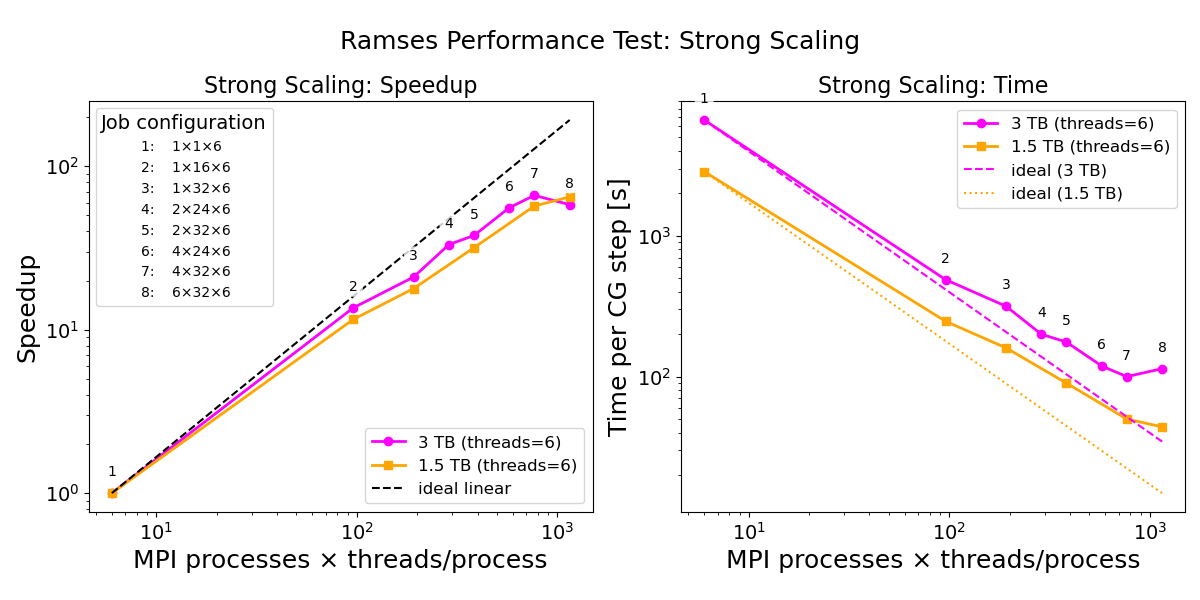
Figure: Results from Strong scaling tests done on RAMSES cluster on 1.5TB and 3TB size datasets. We see a configuartion using 4 nodes, 32 tasks per node and 6 threads per task (data point 7) shows the best speed-up improvement and reduction compute time per conjugate-gradient step while solving the Maximum-likelihood problem.
I am also generating simulations of compact fields (few tens of degrees on sky) and creating mock observations of sources such as planets and molecular cloud fields that is supporting the development of tools required for the first-light of FYST in 2026.
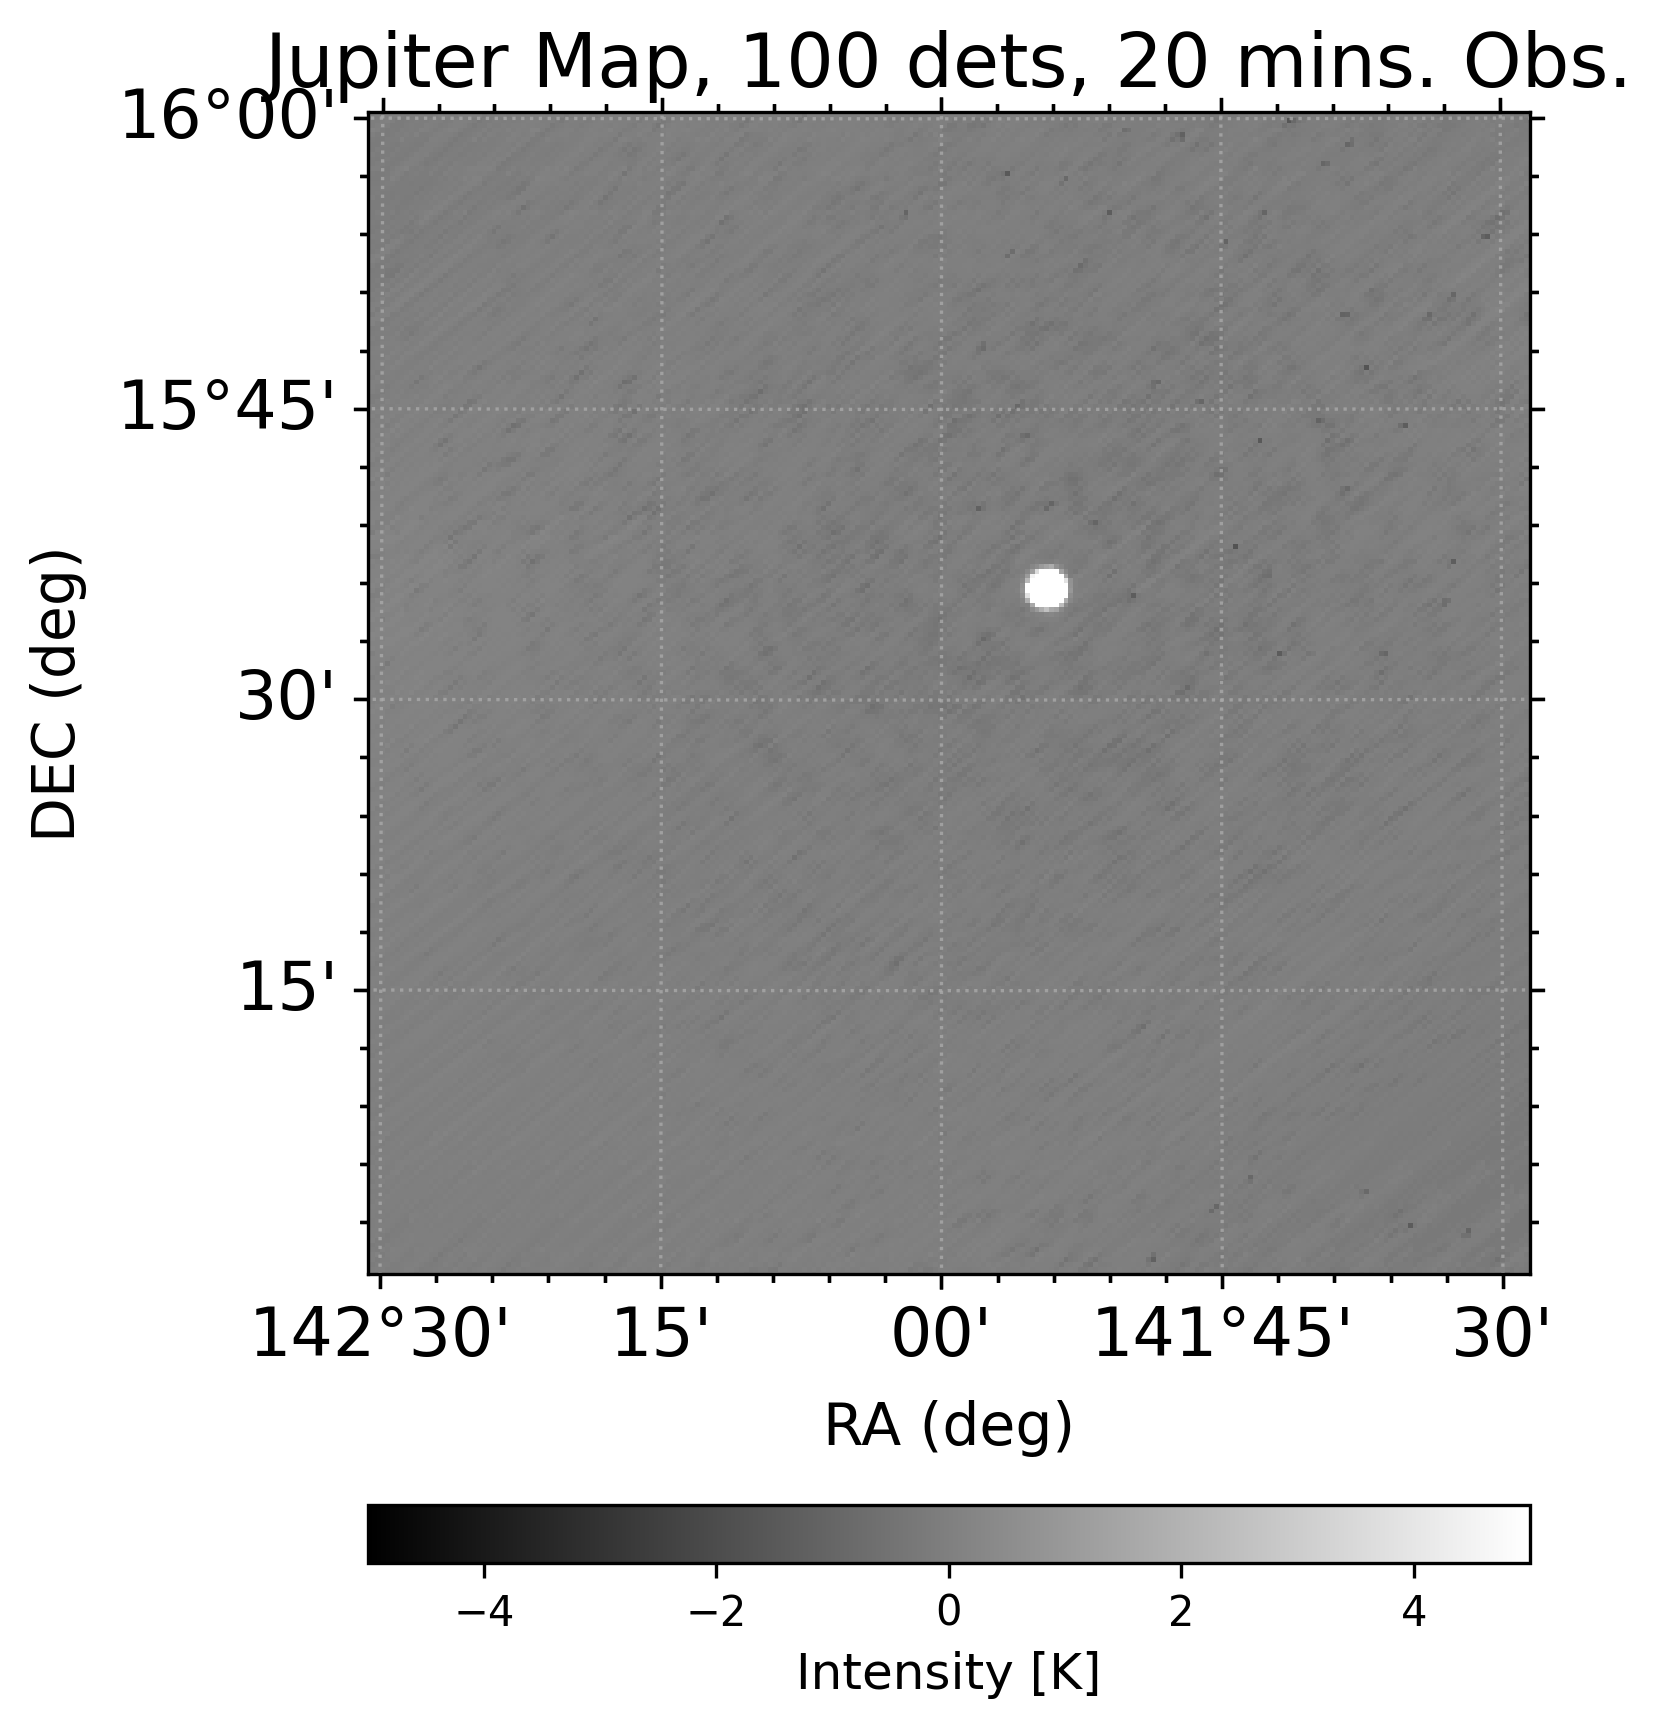
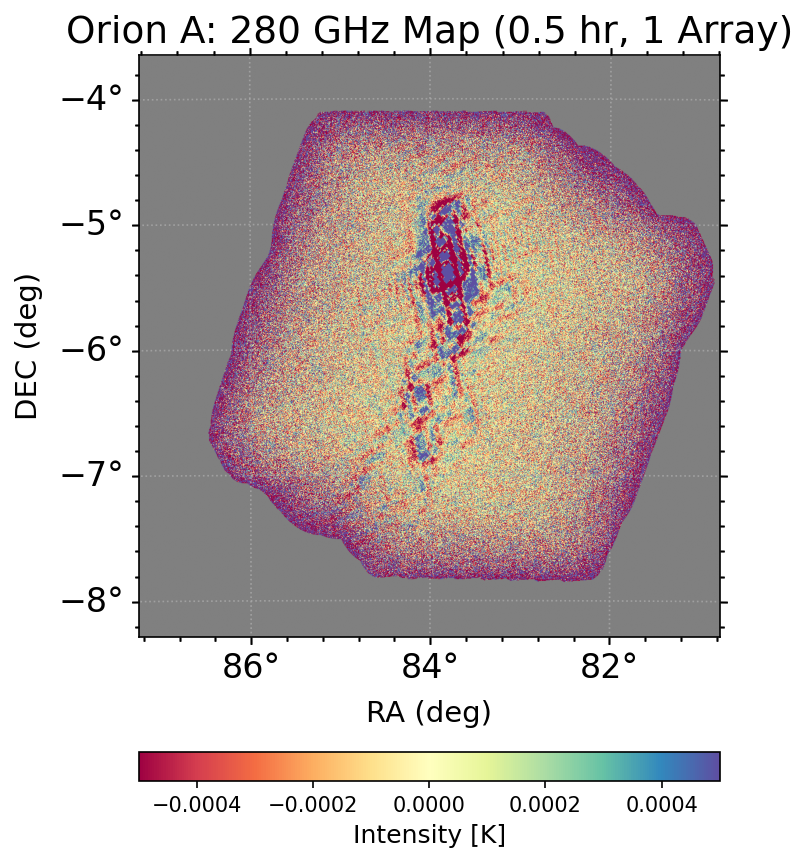
Figure: (Left) Mock observation of Jupiter using simulated 280 GHz camera detectors, observed for 20 minutes. A common mode filter was applied and the cleaned detector timestream was binned into a pixel map. (Right) OrionA star forming region observed for 30 minutes using simulated observations from one array of the 280 GHz camera. A filter-and-bin map-making method was used to filter systematics and atmospheric noise to produce this image of OrionA.